Confirming you are not from the U.S. or the Philippines

یہ بیان دے کر، میں واضح طور پر یہ بتاتا اور تصدیق کرتا ہوں کہ:
  • میں امریکی شہری یا رہائشی نہیں ہوں
  • میں فلپائن کا رہائشی نہیں ہوں
  • میں بالواسطہ یا بلاواسطہ امریکی باشندوں کے 10 فیصد سے زیادہ شیئرز/ ووٹنگ کا حق/ امریکی باشندوں کے انٹرسٹ کا مالک نہیں ہوں اور/یا دوسرے ذرائع سے امریکی شہریوں یا رہائشیوں کو کنٹرول نہیں کرتا ہوں۔
  • میں بالواسطہ یا بلاواسطہ امریکی باشندوں کے 10 فیصد سے زیادہ شیئرز/ ووٹنگ کا حق/ انٹرسٹ کا مالک نہیں ہوں اور/ یا کسی دوسرے ذریعے سے امریکی شہری یا رہائشی کے کنٹرول میں نہیں ہوں۔
  • میں FATCA کے سیکشن (a)1504 کے معاملے میں امریکی شہریوں یا رہائشیوں کے ساتھ وابستہ نہیں ہوں
  • میں غلط اعلان کرنے پر اپنی ذمہ داری سے واقف ہوں۔
اس بیان کے مقاصد کے لئے، ریاستہائے متحدہ امریکہ کے تمام منحصر ممالک اور علاقوں کو امریکہ کے مرکزی علاقے کے برابر کردیا گیا ہے۔ میں اپنے اس بیان کی خلاف ورزی سے پیدا ہونے یا اس سے متعلق ہونے والے کسی بھی دعوے کے خلاف، بے ضرر آکٹا مارکیٹس انکارپوریٹڈ، اس کے ڈائریکٹرز اور افسران کا دفاع کرنے کا عہد کرتا ہوں۔
ہم آپ کی رازداری اور آپ کی ذاتی معلومات کے تحفظ کے لیے وقف ہیں۔ ہم محض اپنی پراڈکٹس اور سروسز کے متعلق خصوصی پیشکشوں اور اہم معلومات فراہم کرنے کے لیے ای میلز اکٹھا کرتے ہیں۔ اپنا ای میل ایڈریس دے کر، آپ ہم سے ایسے ای میلز وصول کرنے پر اتفاق کرتے ہیں۔ اگر آپ انسبسکرائب کرنا چاہتے ہیں یا کوئی سوالات یا خدشات ہوں تو، ہماری کسٹمر سپورٹ کو لکھیں۔
Back

USDJPY Price Analysis: Drops toward the 78.6% Fibo level at 136.60s as bulls take a respite

  • The USD/JPY failed to gain traction despite rising US Treasury yields.
  • USD/JPY Price Analysis: Remains upward biased, though a pullback toward 136.00 is on the cards.

The USD/JPY fell after testing the 20-day Exponential Moving Average (EMA) around 137.88 and dropped below the 137.00 mark in the North American session amid a risk-off impulse. At the time of writing, the USD/JPY is trading at 136.63, below its opening price by 0.84%, after hitting a high of 137.80.

USD/JPY Price Analysis: Technical outlook

From a daily chart perspective, the USD/JPY remains range-bound, within the boundaries of the 20-day EMA and the 200-day EMA, each at 137.88-135.14, respectively. The Relative Strength Index (RSI), at bearish territory, aims downward, while the Rate of Change (RoC) is almost flat, signaling that buying pressure has faded.

Short term, the USD/JPY one-hour chart suggests that buyers are taking a respite after hitting 138.17. The major dived towards the confluence of the 78.6% Fibonacci retracement and the 100-EMA around 136.60, appearing to find support. Nevertheless, if the latter is breached, a fall toward the S1 daily pivot at 135.96 is on the cards. Contrarily, if the USD/JPY rallies toward the 61.8% Fibonacci level at 136.96, a test of the 137.00 figure is likely. Break above will expose the December 13 daily high at 137.97, ahead of the 138.00 mark.
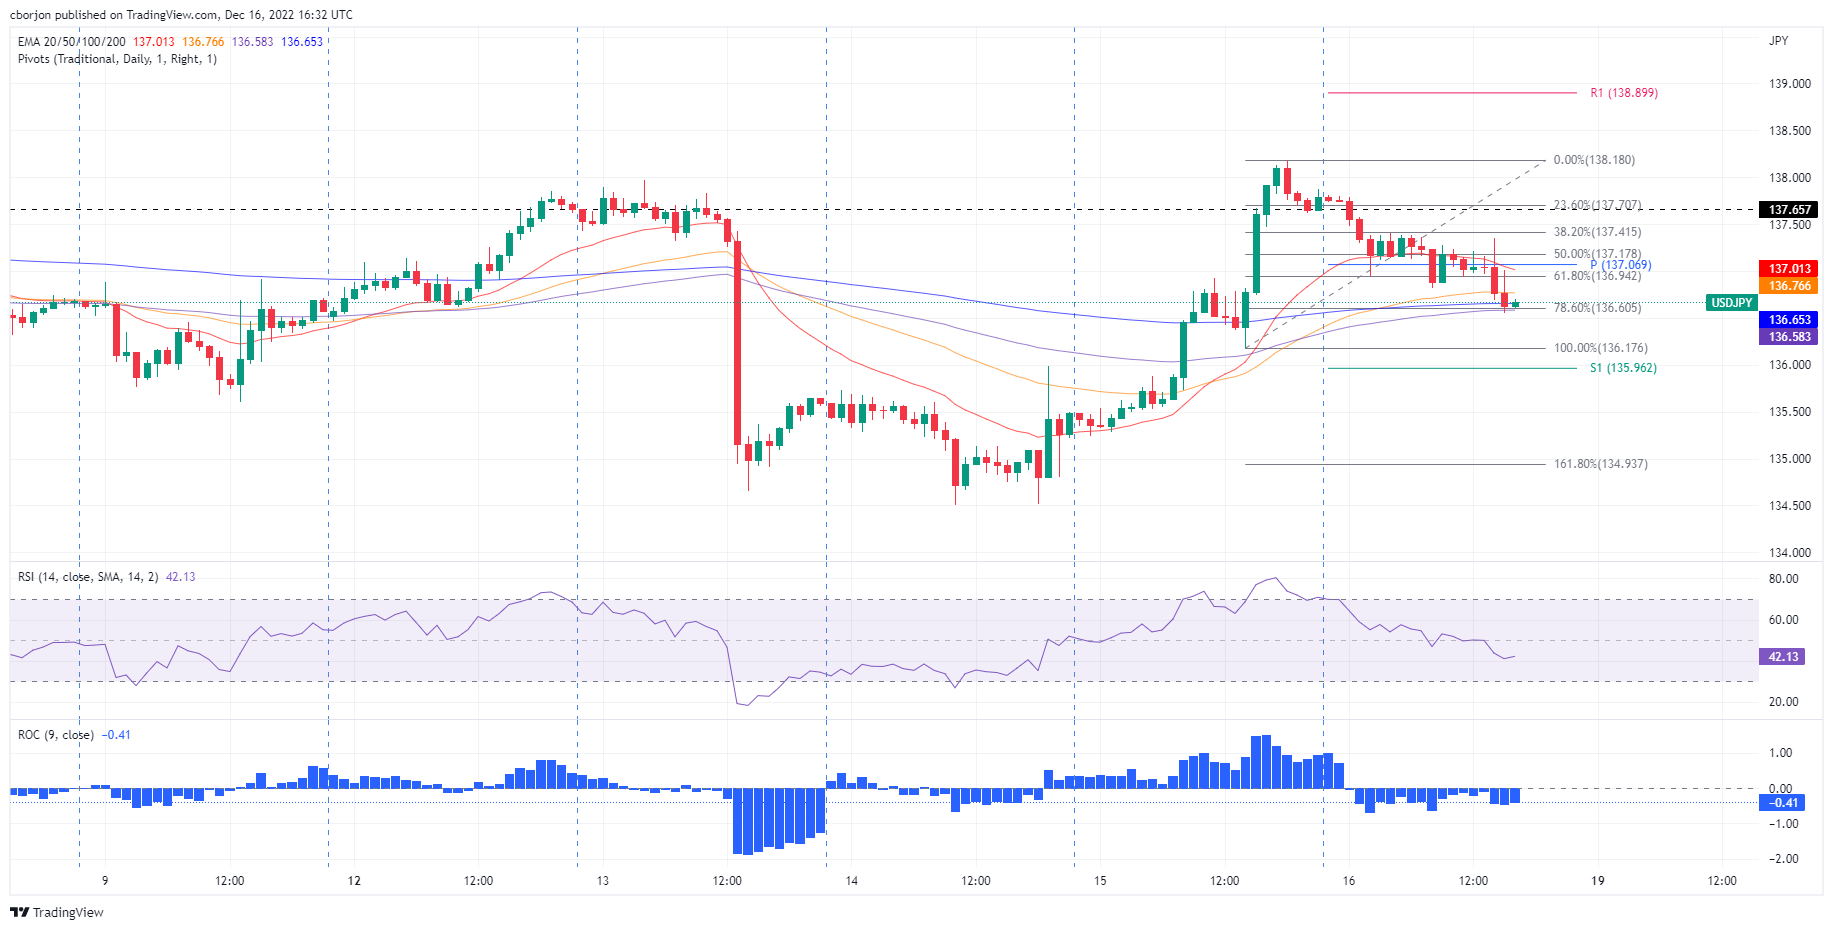
USD/JPY Key Technical Levels


AUD/USD: Fed’s policy to continue supporting the US Dollar – Danske Bank

The AUD/USD pair dropped sharply on Thursday and it stabilized slightly below 0.6700 on Friday. According to analysts from Danske Bank, the AUD/USD pa
مزید پڑھیں Previous

USD/CAD edges higher and meanders around 1.3690s on US Dollar strength

After hitting a daily low of 1.3617, the USD/CAD climbs toward the 1.3700 figure in the North American session after the US Federal Reserve (Fed) deci
مزید پڑھیں Next