Natural Gas Price Analysis: XNG/USD bulls cheer 100-EMA breakout to refresh three-month high, $3.0 in focus
- Natural Gas Price seesaws around the highest levels since March after refreshing the multi-day top.
- The first daily closing beyond 100-EMA since November 2022 favor bulls to approach March’s peak.
- 16-week-old previous resistance line acts as additional downside filter.
Natural Gas Price (XNG/USD) remains on the front foot at the highest levels since March, up 1.60% near $2.87 amid early Monday, as the quote justifies the upside break of the previous key technical hurdles despite mixed oscillators.
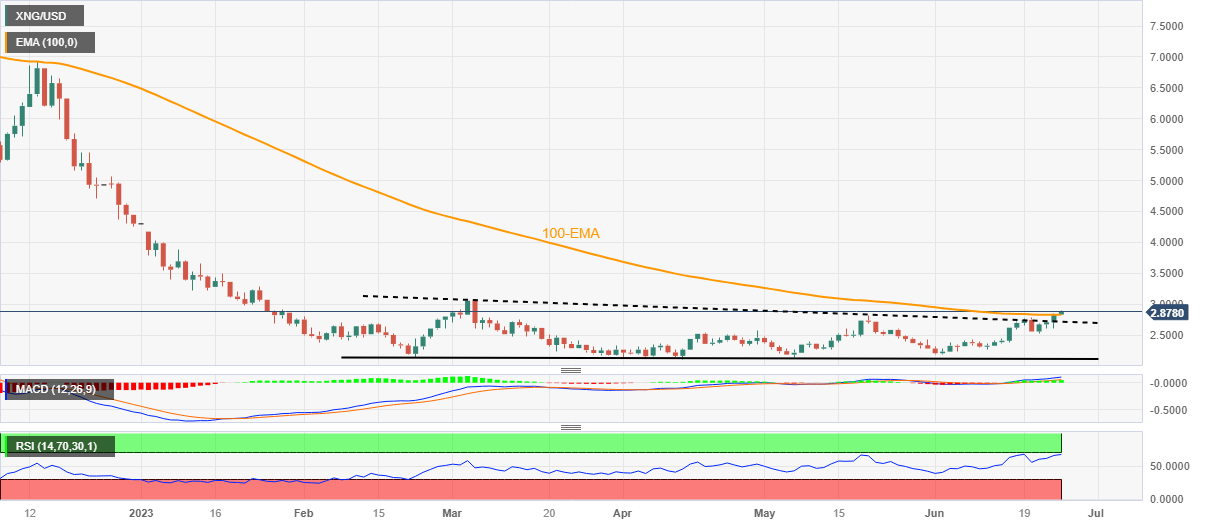
That said, a clear upside break of the 100-day Exponential Moving Average (EMA), around $2.83 by the press time, allows the Natural Gas Price to aim for March’s peak of around $3.0820.
However, the overbought RSI (14) conditions may prod the XNG/USD near the $3.0 round figure.
In a case where the Natural Gas Price remains firmer past $3.08, the odds of witnessing a run-up towards the $4.0 round figure and then to the yearly top surrounding $4.30 can’t be ruled out.
On the flip side, the 100-EMA and previous resistance line from March, respectively near $2.83 and $2.71, restrict the short-term downside of the Natural Gas price.
Following that, a four-month-old horizontal support zone around $2.10, quickly followed by the $2.00 psychological magnet, will challenge the XNG/USD bears.
Overall, the Natural Gas Price appears lucrative for the CNG/USD bulls even if $3.08 seems a short-term peak.
Natural Gas Price: Daily chart
Trend: Further upside expected