Confirming you are not from the U.S. or the Philippines

یہ بیان دے کر، میں واضح طور پر یہ بتاتا اور تصدیق کرتا ہوں کہ:
  • میں امریکی شہری یا رہائشی نہیں ہوں
  • میں فلپائن کا رہائشی نہیں ہوں
  • میں بالواسطہ یا بلاواسطہ امریکی باشندوں کے 10 فیصد سے زیادہ شیئرز/ ووٹنگ کا حق/ امریکی باشندوں کے انٹرسٹ کا مالک نہیں ہوں اور/یا دوسرے ذرائع سے امریکی شہریوں یا رہائشیوں کو کنٹرول نہیں کرتا ہوں۔
  • میں بالواسطہ یا بلاواسطہ امریکی باشندوں کے 10 فیصد سے زیادہ شیئرز/ ووٹنگ کا حق/ انٹرسٹ کا مالک نہیں ہوں اور/ یا کسی دوسرے ذریعے سے امریکی شہری یا رہائشی کے کنٹرول میں نہیں ہوں۔
  • میں FATCA کے سیکشن (a)1504 کے معاملے میں امریکی شہریوں یا رہائشیوں کے ساتھ وابستہ نہیں ہوں
  • میں غلط اعلان کرنے پر اپنی ذمہ داری سے واقف ہوں۔
اس بیان کے مقاصد کے لئے، ریاستہائے متحدہ امریکہ کے تمام منحصر ممالک اور علاقوں کو امریکہ کے مرکزی علاقے کے برابر کردیا گیا ہے۔ میں اپنے اس بیان کی خلاف ورزی سے پیدا ہونے یا اس سے متعلق ہونے والے کسی بھی دعوے کے خلاف، بے ضرر آکٹا مارکیٹس انکارپوریٹڈ، اس کے ڈائریکٹرز اور افسران کا دفاع کرنے کا عہد کرتا ہوں۔
ہم آپ کی رازداری اور آپ کی ذاتی معلومات کے تحفظ کے لیے وقف ہیں۔ ہم محض اپنی پراڈکٹس اور سروسز کے متعلق خصوصی پیشکشوں اور اہم معلومات فراہم کرنے کے لیے ای میلز اکٹھا کرتے ہیں۔ اپنا ای میل ایڈریس دے کر، آپ ہم سے ایسے ای میلز وصول کرنے پر اتفاق کرتے ہیں۔ اگر آپ انسبسکرائب کرنا چاہتے ہیں یا کوئی سوالات یا خدشات ہوں تو، ہماری کسٹمر سپورٹ کو لکھیں۔
Octa trading broker
ٹریڈنگ اکاؤنٹ کھولیں
Back

AUD/JPY Price Analysis: Bulls hold the fort despite closing a losing week

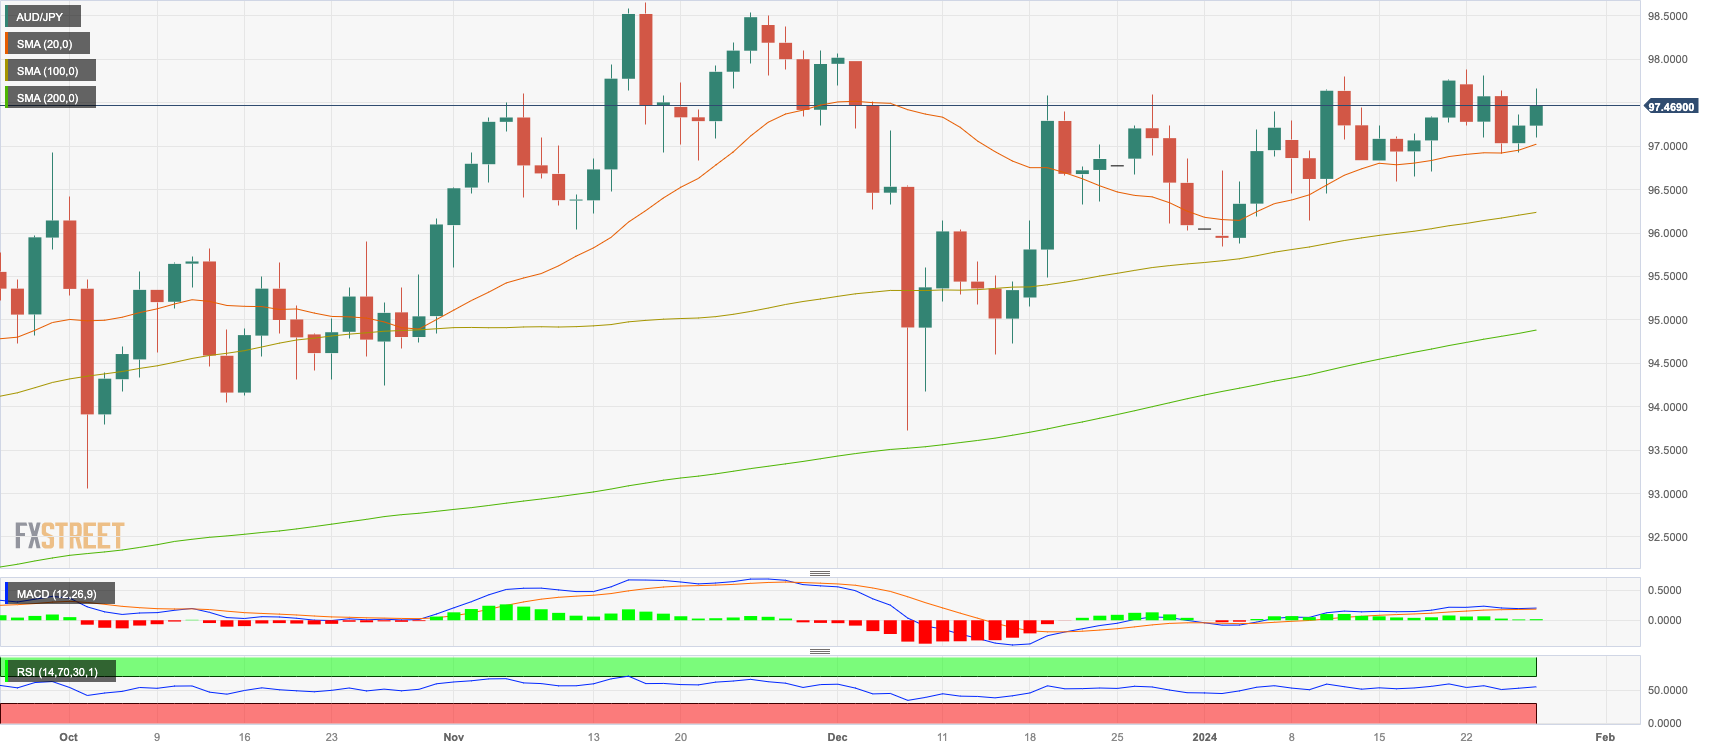
  • The AUD/JPY stands strong at around 97.45, flaunting a gain of 0.25%.
  • Despite the upwards movements, the cross will still close a 0.20% weekly loss.
  • An optimistic scenario is reflected in larger time frames with the pair trading above the 20,100,200-day SMAs.

On Friday's session, the AUD/JPY was trading at 97.45, up by 0.25%. The daily chart shows a neutral to bullish sentiment, with bulls keenly holding their ground while the four-hour outlook mirrors the daily one, with a predominant bullish presence.

The indications on the daily chart reflect a sideway move with a slight bullish inclination. A surge is suggested by the Relative Strength Index (RSI) with a positive slope and lies in positive space, indicating that the buying strength still holds the upper hand. Yet, the Moving Average Convergence Divergence (MACD) showing static green bars suggests a lack of momentum for further bullish advancement. However, positioning above the 20, 100, and 200-day Simple Moving Averages (SMAs) solidifies the evidence that bulls dominate in the long-run realm, even with the weekly retracement.

The four-hour chart, it echoes a similar sentiment. The Relative Strength Index (RSI), still in positive territory and on an upward bend hints at the continued presence of bullish momentum. In the meanwhile, the Moving Average Convergence Divergence (MACD) laying flat with red bars could point to a short-term pullback or consolidation period. Nonetheless, the bulls' persistence indicates that the uptrend may continue in the following trading sessions, assuming that buying pressure remains.

AUD/JPY levels to watch

AUD/JPY daily chart
GBP/USD holds steady amid soft US inflation, ahead of Fed and BoE’s decision

The GBP/USD was virtually unchanged in the mid-North American session on Friday after data from the United States (US) was released.
مزید پڑھیں Previous

Crude Oil looks for the ceiling on Friday as WTI tests $78.00

West Texas Intermediate (WTI) US Crude Oil bid into a two-month high north of 78$.00 per barrel on Friday as barrel traders pile into long bets on continuing geopolitical concerns and near-term supply constraints.
مزید پڑھیں Next