Confirming you are not from the U.S. or the Philippines

یہ بیان دے کر، میں واضح طور پر یہ بتاتا اور تصدیق کرتا ہوں کہ:
  • میں امریکی شہری یا رہائشی نہیں ہوں
  • میں فلپائن کا رہائشی نہیں ہوں
  • میں بالواسطہ یا بلاواسطہ امریکی باشندوں کے 10 فیصد سے زیادہ شیئرز/ ووٹنگ کا حق/ امریکی باشندوں کے انٹرسٹ کا مالک نہیں ہوں اور/یا دوسرے ذرائع سے امریکی شہریوں یا رہائشیوں کو کنٹرول نہیں کرتا ہوں۔
  • میں بالواسطہ یا بلاواسطہ امریکی باشندوں کے 10 فیصد سے زیادہ شیئرز/ ووٹنگ کا حق/ انٹرسٹ کا مالک نہیں ہوں اور/ یا کسی دوسرے ذریعے سے امریکی شہری یا رہائشی کے کنٹرول میں نہیں ہوں۔
  • میں FATCA کے سیکشن (a)1504 کے معاملے میں امریکی شہریوں یا رہائشیوں کے ساتھ وابستہ نہیں ہوں
  • میں غلط اعلان کرنے پر اپنی ذمہ داری سے واقف ہوں۔
اس بیان کے مقاصد کے لئے، ریاستہائے متحدہ امریکہ کے تمام منحصر ممالک اور علاقوں کو امریکہ کے مرکزی علاقے کے برابر کردیا گیا ہے۔ میں اپنے اس بیان کی خلاف ورزی سے پیدا ہونے یا اس سے متعلق ہونے والے کسی بھی دعوے کے خلاف، بے ضرر آکٹا مارکیٹس انکارپوریٹڈ، اس کے ڈائریکٹرز اور افسران کا دفاع کرنے کا عہد کرتا ہوں۔
ہم آپ کی رازداری اور آپ کی ذاتی معلومات کے تحفظ کے لیے وقف ہیں۔ ہم محض اپنی پراڈکٹس اور سروسز کے متعلق خصوصی پیشکشوں اور اہم معلومات فراہم کرنے کے لیے ای میلز اکٹھا کرتے ہیں۔ اپنا ای میل ایڈریس دے کر، آپ ہم سے ایسے ای میلز وصول کرنے پر اتفاق کرتے ہیں۔ اگر آپ انسبسکرائب کرنا چاہتے ہیں یا کوئی سوالات یا خدشات ہوں تو، ہماری کسٹمر سپورٹ کو لکھیں۔
Octa trading broker
ٹریڈنگ اکاؤنٹ کھولیں
Test
Back

EUR/JPY Price Analysis: Mildly bullish sentiment persists, bears present

  • The daily EUR/JPY chart reveals a cautiously optimistic tone, despite a somewhat weakened RSI.
  • Indicators on the hourly chart also suggest weakening buying momentum.
  • If bulls fail to recapture the 20-day SMA, additional downside may be incoming.

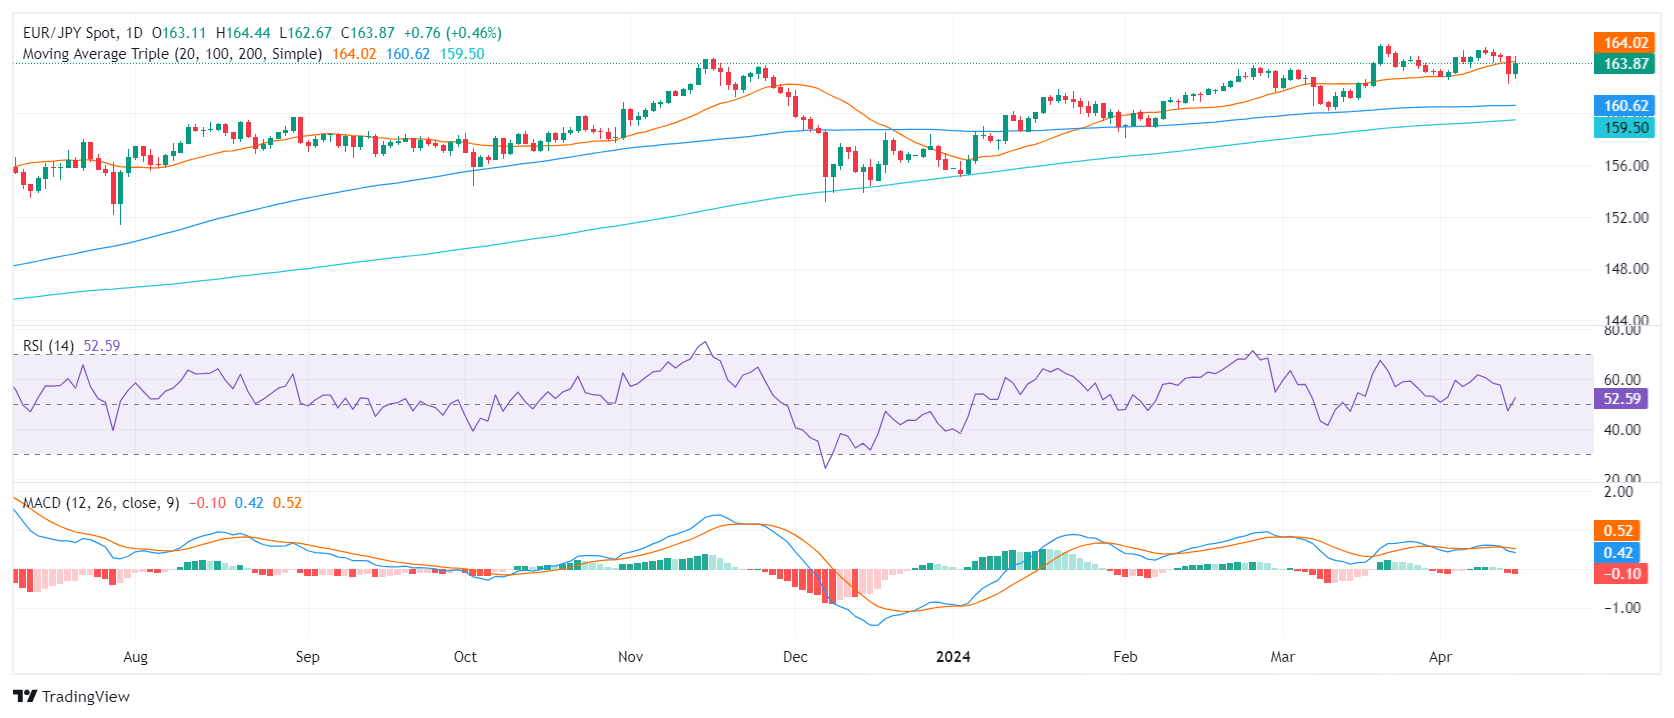
The EUR/JPY pair is currently trading at 163.80, indicating a rise of 0.46%. The cross maintains a positive long-term outlook, despite the short-term bearish impulses from sellers which breached through the 20-day Simple Moving Average (SMA). For the session, bulls seem to have already given all as indicators lose traction in the shorter timeframes.

The latest daily EUR/JPY chart session has shown a Relative Strength Index (RSI) in the positive territory, reflecting a mildly bullish sentiment. However, the fluctuating RSI observed in the last sessions and the recent dip into the negative territory suggests that bears are gearing up. Concurrently, the Moving Average Convergence Divergence (MACD) histogram reveals an uptrend with rising red bars, highlighting bearish momentum.

EUR/JPY daily chart
 

Turning to the hourly EUR/JPY chart, the RSI appears predominantly positive with a current reading of 57 but points downwards. The MACD Histogram on this timeframe shows diminishing green bars, further indicating lessening bullish momentum.

EUR/JPY hourly chart
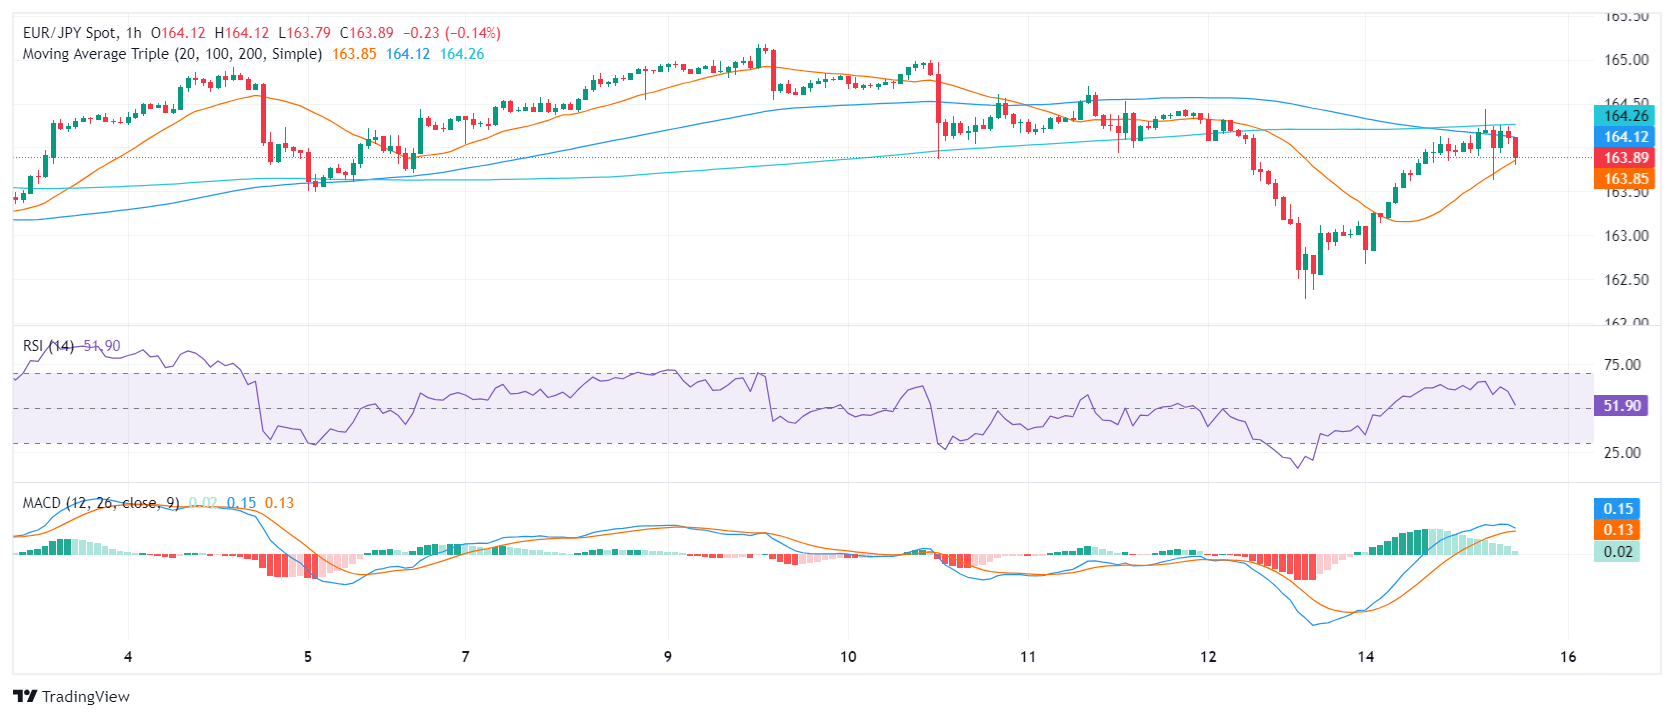
From a broader perspective, the EUR/JPY is giving mixed signals. Notably, it has fallen below its 20-day Simple Moving Average (SMA) today which may be seen as a bearish short-term indicator. However, it stays above both its 100-day and 200-day SMAs, suggesting a persisting long-term bullish trend.

In summary, the technical indicators on both the daily and hourly charts present a mixed outlook for the EUR/JPY pair. The short-term bearish signals are juxtaposed with a sustained long-term bullish trend, signifying prospective market volatility. Buyers seem to have made one last stride on Monday, but their momentum is weakening, and unless the buyers regain the 20-day SMA, the outlook might shift in favor of the bears.


EUR/JPY

Overview
Today last price 163.87
Today Daily Change 0.76
Today Daily Change % 0.47
Today daily open 163.11
 
Trends
Daily SMA20 163.94
Daily SMA50 162.65
Daily SMA100 160.61
Daily SMA200 159.46
 
Levels
Previous Daily High 164.44
Previous Daily Low 162.28
Previous Weekly High 165.18
Previous Weekly Low 162.28
Previous Monthly High 165.36
Previous Monthly Low 160.22
Daily Fibonacci 38.2% 163.1
Daily Fibonacci 61.8% 163.61
Daily Pivot Point S1 162.11
Daily Pivot Point S2 161.11
Daily Pivot Point S3 159.95
Daily Pivot Point R1 164.27
Daily Pivot Point R2 165.44
Daily Pivot Point R3 166.44


EUR/USD is testing Friday’s lows at 1.0620 with the US Dollar boosted by strong consumption figures

The Euro resumes its decline following strong US Retail Sales data The divergence between the ECB and the Fed's rate outlook is expected to weigh on the Euro.
مزید پڑھیں Previous

AUD/USD dips amid strong US Retail Sales and risk aversion

The Aussie Dollar extended its losses against the Greenback during the North American session, dropping some 0.08% after hitting a daily high of 0.6493.
مزید پڑھیں Next