Back

AUD/NZD gains ground on robust Australian data, markets digest NZ tax relief

  • The AUD/NZD rebounded to a high of 1.0840 after dipping to 1.0815 on Wednesday.
  • Strong data from Australia following the report of hot inflation figures reported at the beginning of the week benefited the AUD.
  • New Zealand's newly announced tax cut policy may delay the RBNZ's rate cuts.

The AUD/NZD was seen trading higher during Thursday's session as markets digested mid-tier Australian data and a fresh fiscal policy from New Zealand.

In Australia, the robust Q1 business investment and higher-than-expected private capital expenditure figures supported the AUD. On Tuesday, the country reported higher-than-expected inflation figures which coupled with strong economic data may prompt the Reserve Bank of Australia (RBA) to turn more hawkish. On Wednesday Gross Domestic Product (GDP) will be closely followed.

Simultaneously, New Zealand's new government announced an NZD 14.7 billion tax cut package for low and middle-income households. A more lax fiscal policy has softened expectations of imminent rate cuts by the Reserve Bank of New Zealand (RBNZ) which could eventually limit the losses for the Kiwi. The odds of a cut in November fell slightly but remain priced at around 70%.

AUD/NZD technical analysis

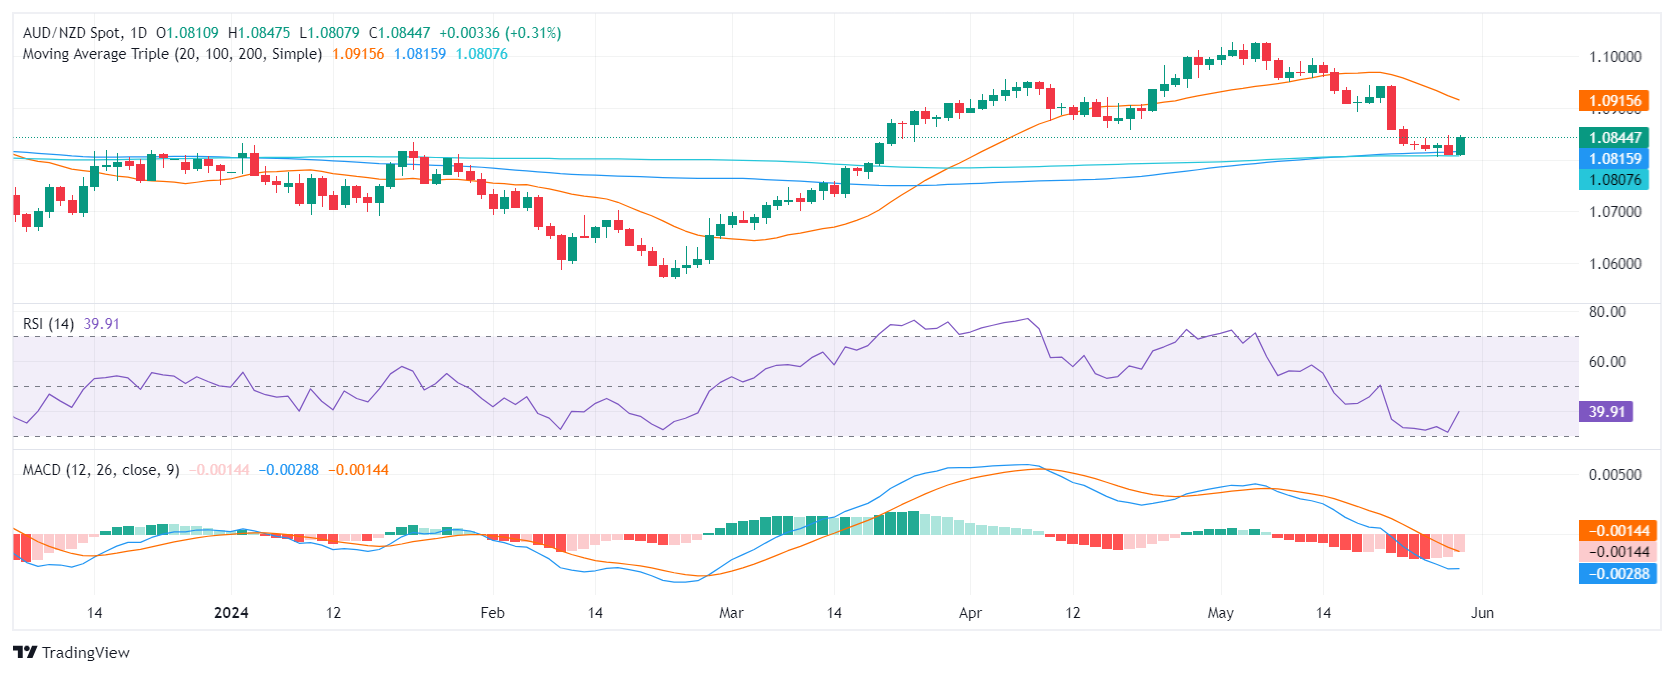
On the daily chart, the Relative Strength Index (RSI) remains in negative territory, indicating a firm downtrend. The persistent rise of the red bars of the Moving Average Convergence Divergence (MACD) histogram further solidifies this downward momentum.

However, as the pair approached oversold territory on Wednesday indicators saw a slight upward correction on Thursday, which is in line with the latest market developments as sellers seem to be taking a breather.

AUD/NZD daily chart

AUD/NZD

Overview
Today last price 1.0842
Today Daily Change 0.0031
Today Daily Change % 0.29
Today daily open 1.0811
 
Trends
Daily SMA20 1.0924
Daily SMA50 1.0921
Daily SMA100 1.0815
Daily SMA200 1.0808
 
Levels
Previous Daily High 1.0849
Previous Daily Low 1.081
Previous Weekly High 1.0944
Previous Weekly Low 1.0819
Previous Monthly High 1.1012
Previous Monthly Low 1.0857
Daily Fibonacci 38.2% 1.0825
Daily Fibonacci 61.8% 1.0834
Daily Pivot Point S1 1.0798
Daily Pivot Point S2 1.0785
Daily Pivot Point S3 1.076
Daily Pivot Point R1 1.0836
Daily Pivot Point R2 1.0862
Daily Pivot Point R3 1.0875


Forex Today: The FX universe now looks at US PCE

A corrective move saw the US Dollar lose some upside impetus on Thursday, helping the risk complex recoup some ground prior to the release of advanced inflation figures in the euro area and US PCE, all due on Friday.
مزید پڑھیں Previous

USD/JPY Price Analysis: Slips below 157.00 as bearish engulfing pattern looms

The USD/JPY dropped from weekly highs of 157.71 on May 29 after data from the United States (US) painted an ongoing economic slowdown, which sent US Treasury yields plunging.
مزید پڑھیں Next