Confirming you are not from the U.S. or the Philippines

یہ بیان دے کر، میں واضح طور پر یہ بتاتا اور تصدیق کرتا ہوں کہ:
  • میں امریکی شہری یا رہائشی نہیں ہوں
  • میں فلپائن کا رہائشی نہیں ہوں
  • میں بالواسطہ یا بلاواسطہ امریکی باشندوں کے 10 فیصد سے زیادہ شیئرز/ ووٹنگ کا حق/ امریکی باشندوں کے انٹرسٹ کا مالک نہیں ہوں اور/یا دوسرے ذرائع سے امریکی شہریوں یا رہائشیوں کو کنٹرول نہیں کرتا ہوں۔
  • میں بالواسطہ یا بلاواسطہ امریکی باشندوں کے 10 فیصد سے زیادہ شیئرز/ ووٹنگ کا حق/ انٹرسٹ کا مالک نہیں ہوں اور/ یا کسی دوسرے ذریعے سے امریکی شہری یا رہائشی کے کنٹرول میں نہیں ہوں۔
  • میں FATCA کے سیکشن (a)1504 کے معاملے میں امریکی شہریوں یا رہائشیوں کے ساتھ وابستہ نہیں ہوں
  • میں غلط اعلان کرنے پر اپنی ذمہ داری سے واقف ہوں۔
اس بیان کے مقاصد کے لئے، ریاستہائے متحدہ امریکہ کے تمام منحصر ممالک اور علاقوں کو امریکہ کے مرکزی علاقے کے برابر کردیا گیا ہے۔ میں اپنے اس بیان کی خلاف ورزی سے پیدا ہونے یا اس سے متعلق ہونے والے کسی بھی دعوے کے خلاف، بے ضرر آکٹا مارکیٹس انکارپوریٹڈ، اس کے ڈائریکٹرز اور افسران کا دفاع کرنے کا عہد کرتا ہوں۔
ہم آپ کی رازداری اور آپ کی ذاتی معلومات کے تحفظ کے لیے وقف ہیں۔ ہم محض اپنی پراڈکٹس اور سروسز کے متعلق خصوصی پیشکشوں اور اہم معلومات فراہم کرنے کے لیے ای میلز اکٹھا کرتے ہیں۔ اپنا ای میل ایڈریس دے کر، آپ ہم سے ایسے ای میلز وصول کرنے پر اتفاق کرتے ہیں۔ اگر آپ انسبسکرائب کرنا چاہتے ہیں یا کوئی سوالات یا خدشات ہوں تو، ہماری کسٹمر سپورٹ کو لکھیں۔
Octa trading broker
ٹریڈنگ اکاؤنٹ کھولیں
Back

NZD/USD Price Analysis: Bulls attempt to reclaim 20-day SMA

  • NZD/USD climbs on Tuesday, reaching 0.5655 as buyers gain traction.
  • The pair tests the 20-day SMA at 0.5650, a key technical threshold.
  • Momentum indicators show mixed signals, with bullish attempts facing resistance.

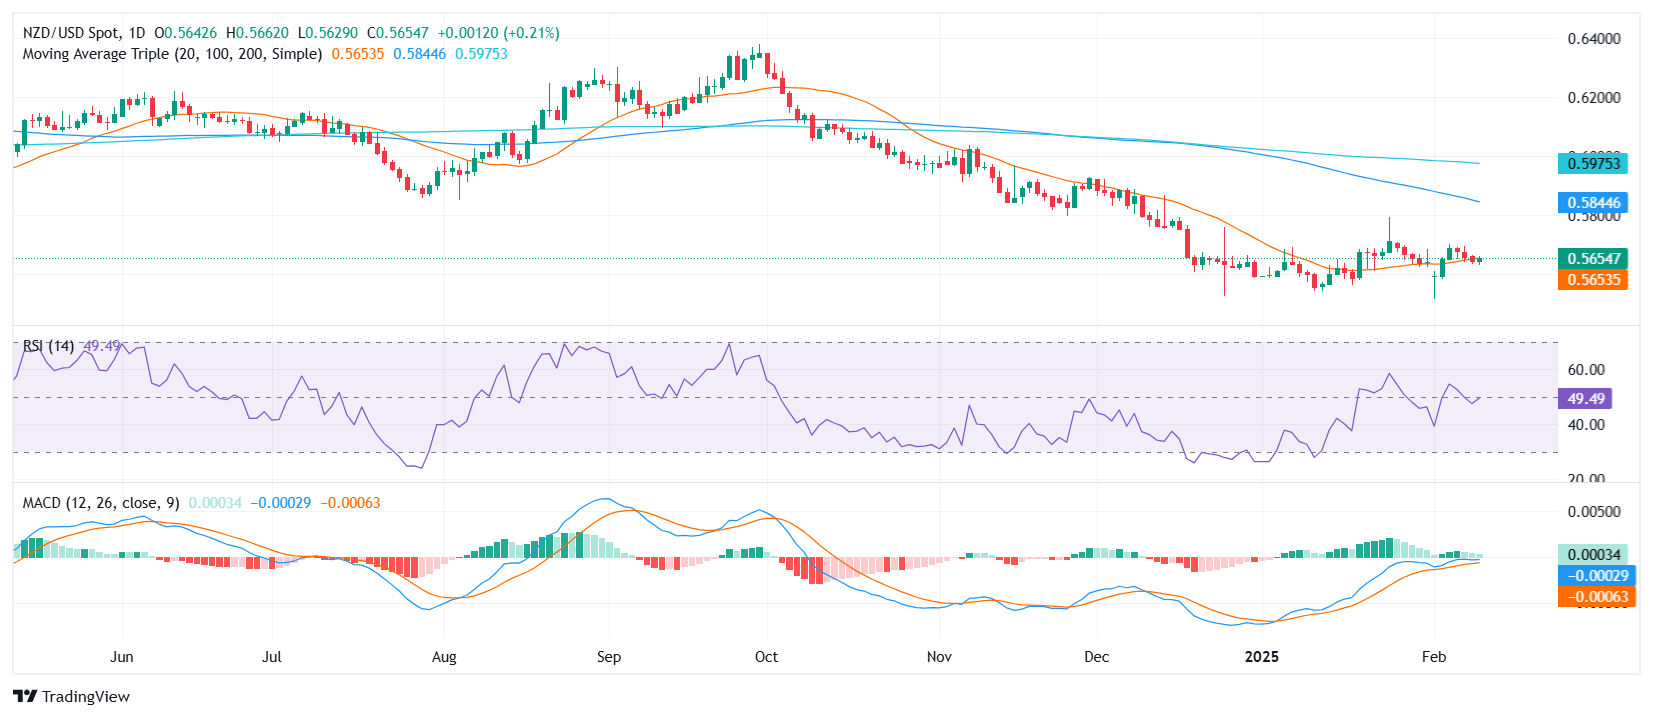
NZD/USD advanced on Tuesday, rising 0.31% to trade at 0.5655 as bulls attempted to regain control. The pair is currently testing the 20-day Simple Moving Average (SMA) at 0.5650, a level that has acted as a key resistance zone. A sustained hold above this mark could improve the near-term outlook, while failure to maintain upward pressure may leave the pair vulnerable to renewed selling.

Technical indicators offer a mixed perspective. The Relative Strength Index (RSI) has climbed sharply to 51, signaling improving bullish sentiment as it moves into positive territory. However, the Moving Average Convergence Divergence (MACD) histogram remains flat with green bars, suggesting that while selling pressure has eased, bullish momentum remains tentative.

Looking ahead, a decisive break above 0.5670 could open the door toward 0.5700, reinforcing a more constructive bias. On the downside, if the pair fails to hold the 20-day SMA, sellers may regain control, with immediate support emerging at 0.5620, followed by the 0.5600 psychological level.

NZD/USD daily chart

United States API Weekly Crude Oil Stock came in at 9.043M, above forecasts (2.8M) in February 7

United States API Weekly Crude Oil Stock came in at 9.043M, above forecasts (2.8M) in February 7
مزید پڑھیں Previous

AUD/JPY Price Forecast: Stages recovery after hitting five-month low

The AUD/JPY bounced off after hitting five-month lows of 94.30 on February 10, yet buyers stepped in and pushed the cross-pair above the 95.00 mark.
مزید پڑھیں Next