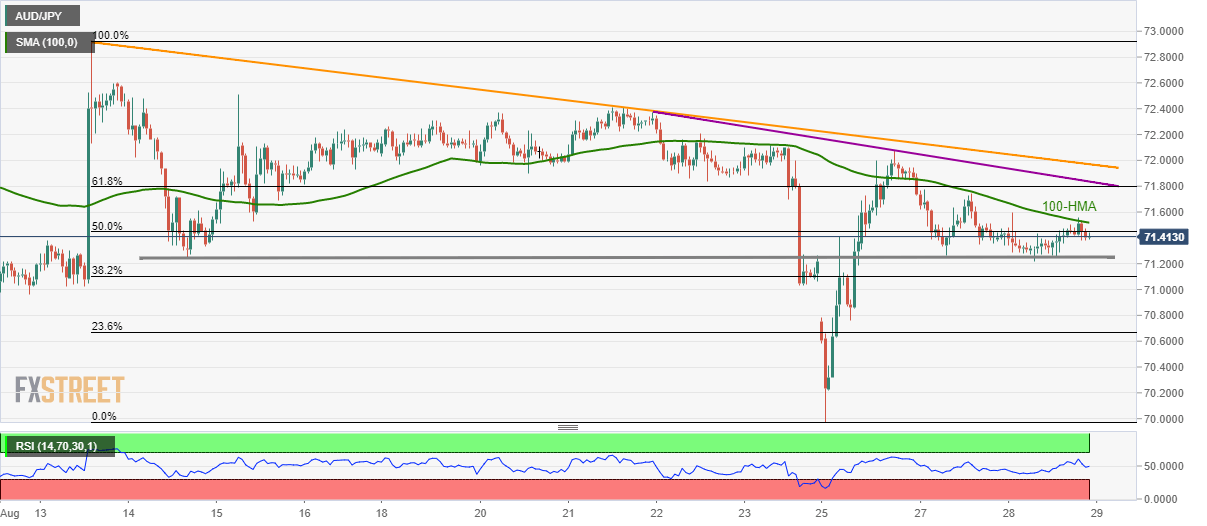
AUD/JPY technical analysis: 100-HMA exerts immediate downside pressure
- AUD/JPY remains on the back foot with its repeated failures to cross 100-HMA.
- A horizontal line around 71.25 has been acting as the key support since August 14.
With the 100-hour moving average (HMA) aptly limiting the AUD/JPY pair’s immediate upside, the quote stays on the back foot while taking rounds to 71.41 during Asian morning on Thursday.
Even so, a two-week-old horizontal-line near 71.25 limits the AUD/JPY pair’s near-term declines, which if ignored could drag prices to 71.00 round-figure.
It should also be noted that the week-start gap near 70.75 can question pair’s further downside, if not then 70.00 will become sellers’ favorite.
On the upside, successful break of 100-HMA, at 71.52 now, propels the AUD/JPY pair towards 61.8% Fibonacci retracement level of its downpour between August 13 and 25, at 71.80.
In a case where buyers dominate beyond 71.80, the downward sloping trend-lines since August 21 and August 13, around 71.84 and 71.97 respectively, will be in the spotlight.
AUD/JPY hourly chart

Trend: sideways
