Back
18 Oct 2019
GBP/USD technical analysis: 200-day SMA is the level to beat for bears, 1.3000 lures bulls
- GBP/USD consolidates from a multi-month high, still beyond the key 61.8% Fibonacci retracement.
- Sustained trading above 200-day SMA, bullish MACD favors another confrontation to 1.3000 mark.
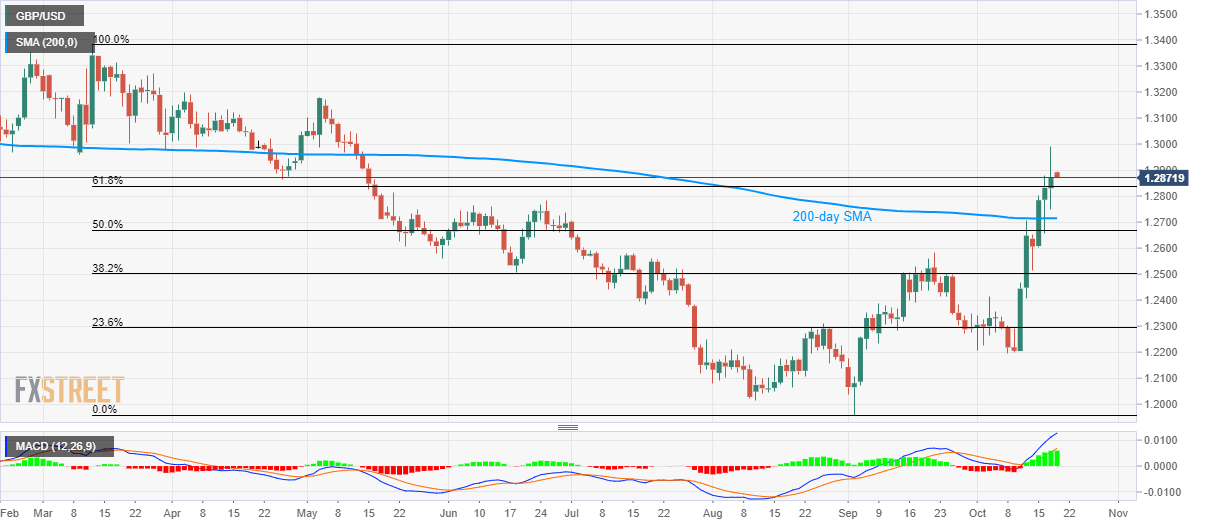
With the prices successfully trading beyond 200-day Simple Moving Average (SMA) and 61.8% Fibonacci retracement of March-September declines, GBP/USD traders are less worried about the latest pullback to 1.2870 by the press time of Friday’s Asian session.
The buyers keep targeting 1.3000 round-figure while taking positive clues from the 12-bar Moving Average Convergence and Divergence (MACD) indicator whereas sellers await a downside break of 61.8% Fibonacci retracement level of 1.2840 to revisit 200-day SMA, at 1.2715 now.
However, pair’s declines below 200-day SMA will recall bears aiming September month high near 1.2580.
On the contrary, an upside beyond 1.3000 could well place optimists to question May’s top of 1.3178.
GBP/USD daily chart
Trend: bullish