Back


13 Feb 2020
EUR/JPY Price Analysis: Euro drop to its lowest since October 2019 vs. yen
- EUR/JPY is under heavy pressure near four-month lows.
- The level to beat for bears is the 118.73 support.
EUR/JPY daily chart
EUR/JPY is trading close to four-months lows while trading under its main daily simple moving averages (SMAs).

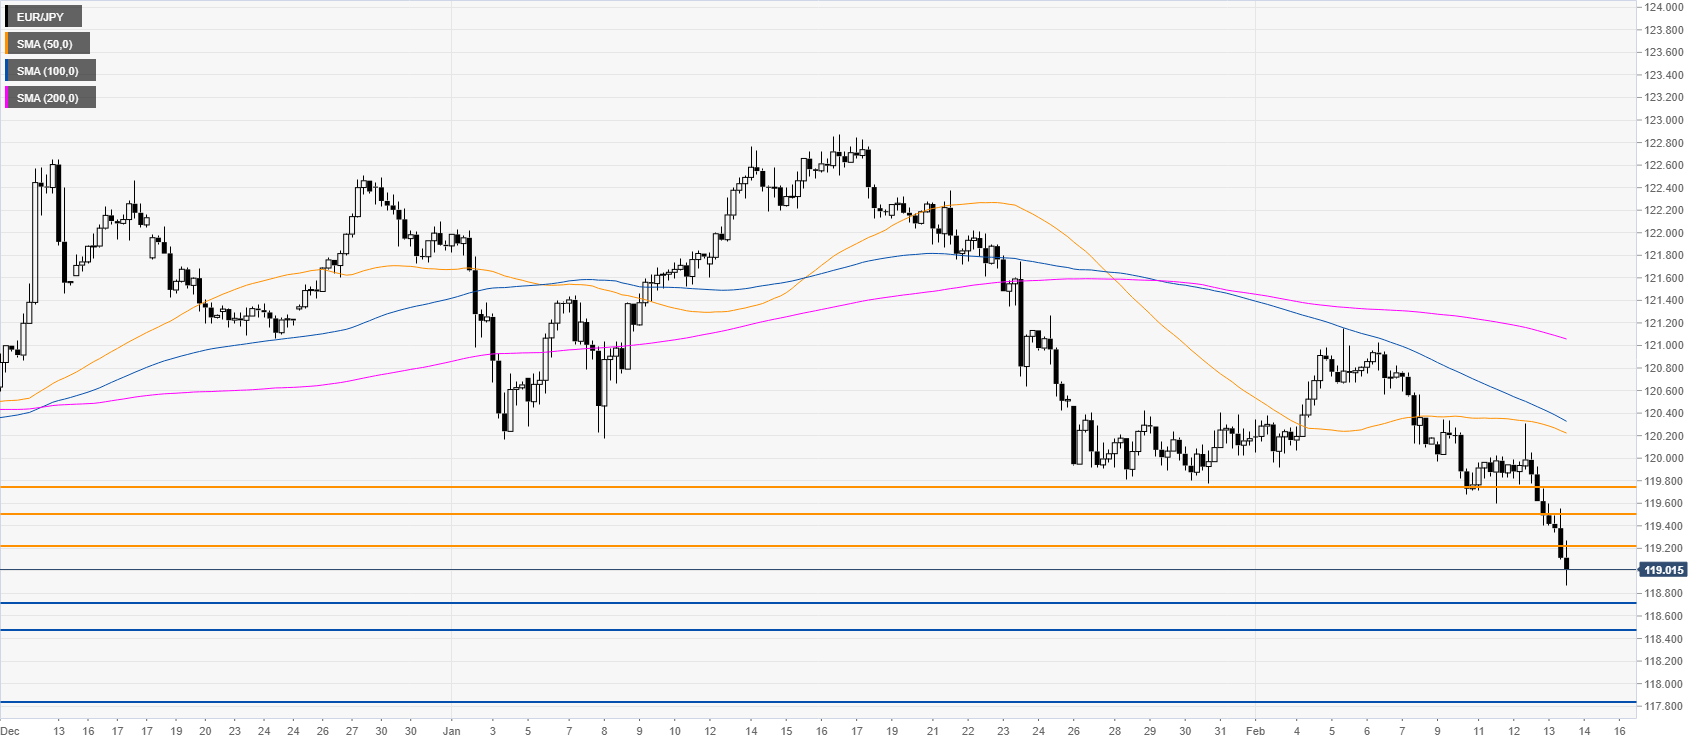
EUR/JPY four-hour chart
The spot is trading below its main SMAs suggesting a bearish bias in the medium term. As the market is dropping to four-month lows, the bears are looking for a continuation down towards the 118.73 level. A break below the above-mentioned support could lead to extra losses towards the 118.49 and 117.87 levels. Resistance is seen near the 119.23, 119.48 and 119.73 price levels, according to the Technical Confluences Indicator.

Resistance: 119.23, 119.48, 119.73
Support: 118.73, 118.49, 117.87
Additional key levels
