Confirming you are not from the U.S. or the Philippines

یہ بیان دے کر، میں واضح طور پر یہ بتاتا اور تصدیق کرتا ہوں کہ:
  • میں امریکی شہری یا رہائشی نہیں ہوں
  • میں فلپائن کا رہائشی نہیں ہوں
  • میں بالواسطہ یا بلاواسطہ امریکی باشندوں کے 10 فیصد سے زیادہ شیئرز/ ووٹنگ کا حق/ امریکی باشندوں کے انٹرسٹ کا مالک نہیں ہوں اور/یا دوسرے ذرائع سے امریکی شہریوں یا رہائشیوں کو کنٹرول نہیں کرتا ہوں۔
  • میں بالواسطہ یا بلاواسطہ امریکی باشندوں کے 10 فیصد سے زیادہ شیئرز/ ووٹنگ کا حق/ انٹرسٹ کا مالک نہیں ہوں اور/ یا کسی دوسرے ذریعے سے امریکی شہری یا رہائشی کے کنٹرول میں نہیں ہوں۔
  • میں FATCA کے سیکشن (a)1504 کے معاملے میں امریکی شہریوں یا رہائشیوں کے ساتھ وابستہ نہیں ہوں
  • میں غلط اعلان کرنے پر اپنی ذمہ داری سے واقف ہوں۔
اس بیان کے مقاصد کے لئے، ریاستہائے متحدہ امریکہ کے تمام منحصر ممالک اور علاقوں کو امریکہ کے مرکزی علاقے کے برابر کردیا گیا ہے۔ میں اپنے اس بیان کی خلاف ورزی سے پیدا ہونے یا اس سے متعلق ہونے والے کسی بھی دعوے کے خلاف، بے ضرر آکٹا مارکیٹس انکارپوریٹڈ، اس کے ڈائریکٹرز اور افسران کا دفاع کرنے کا عہد کرتا ہوں۔
ہم آپ کی رازداری اور آپ کی ذاتی معلومات کے تحفظ کے لیے وقف ہیں۔ ہم محض اپنی پراڈکٹس اور سروسز کے متعلق خصوصی پیشکشوں اور اہم معلومات فراہم کرنے کے لیے ای میلز اکٹھا کرتے ہیں۔ اپنا ای میل ایڈریس دے کر، آپ ہم سے ایسے ای میلز وصول کرنے پر اتفاق کرتے ہیں۔ اگر آپ انسبسکرائب کرنا چاہتے ہیں یا کوئی سوالات یا خدشات ہوں تو، ہماری کسٹمر سپورٹ کو لکھیں۔
Back

WTI Price Analysis: Oil hits two-month low

  • WTI crude hits the lowest level in two months. 
  • The bearish momentum looks strong, as per technical studies. 

West Texas Intermediate (WTI), a North American crude oil benchmark, fell to $38.55 on Tuesday – the lowest since July 10. 

At the current price of $39, the black gold is down 10.4% from $43.57 – the high of the bearish inverted hammer candle created on July 31. That candlestick pattern had warned of an impending sell-off. 

More importantly, the price drop could be extended this week, as the daily chart MACD histogram is now printing deeper bars below the zero line. That's a sign of the strengthening of downward momentum. 
 
The 14-day RSI is signaling bearish conditions with a below-50 print, and the 5- and 10-day simple moving averages are trending south, indicating a bearish setup. 

On the downside, key supports are seen at $38.54 (July 10 low) and $37.08 (June 25 low). Alternatively, resistances are located at $40 (psychological level) and $41.97 (10-day SMA). A close above the 10-day SMA is needed to invalidate the bearish bias

Daily chart
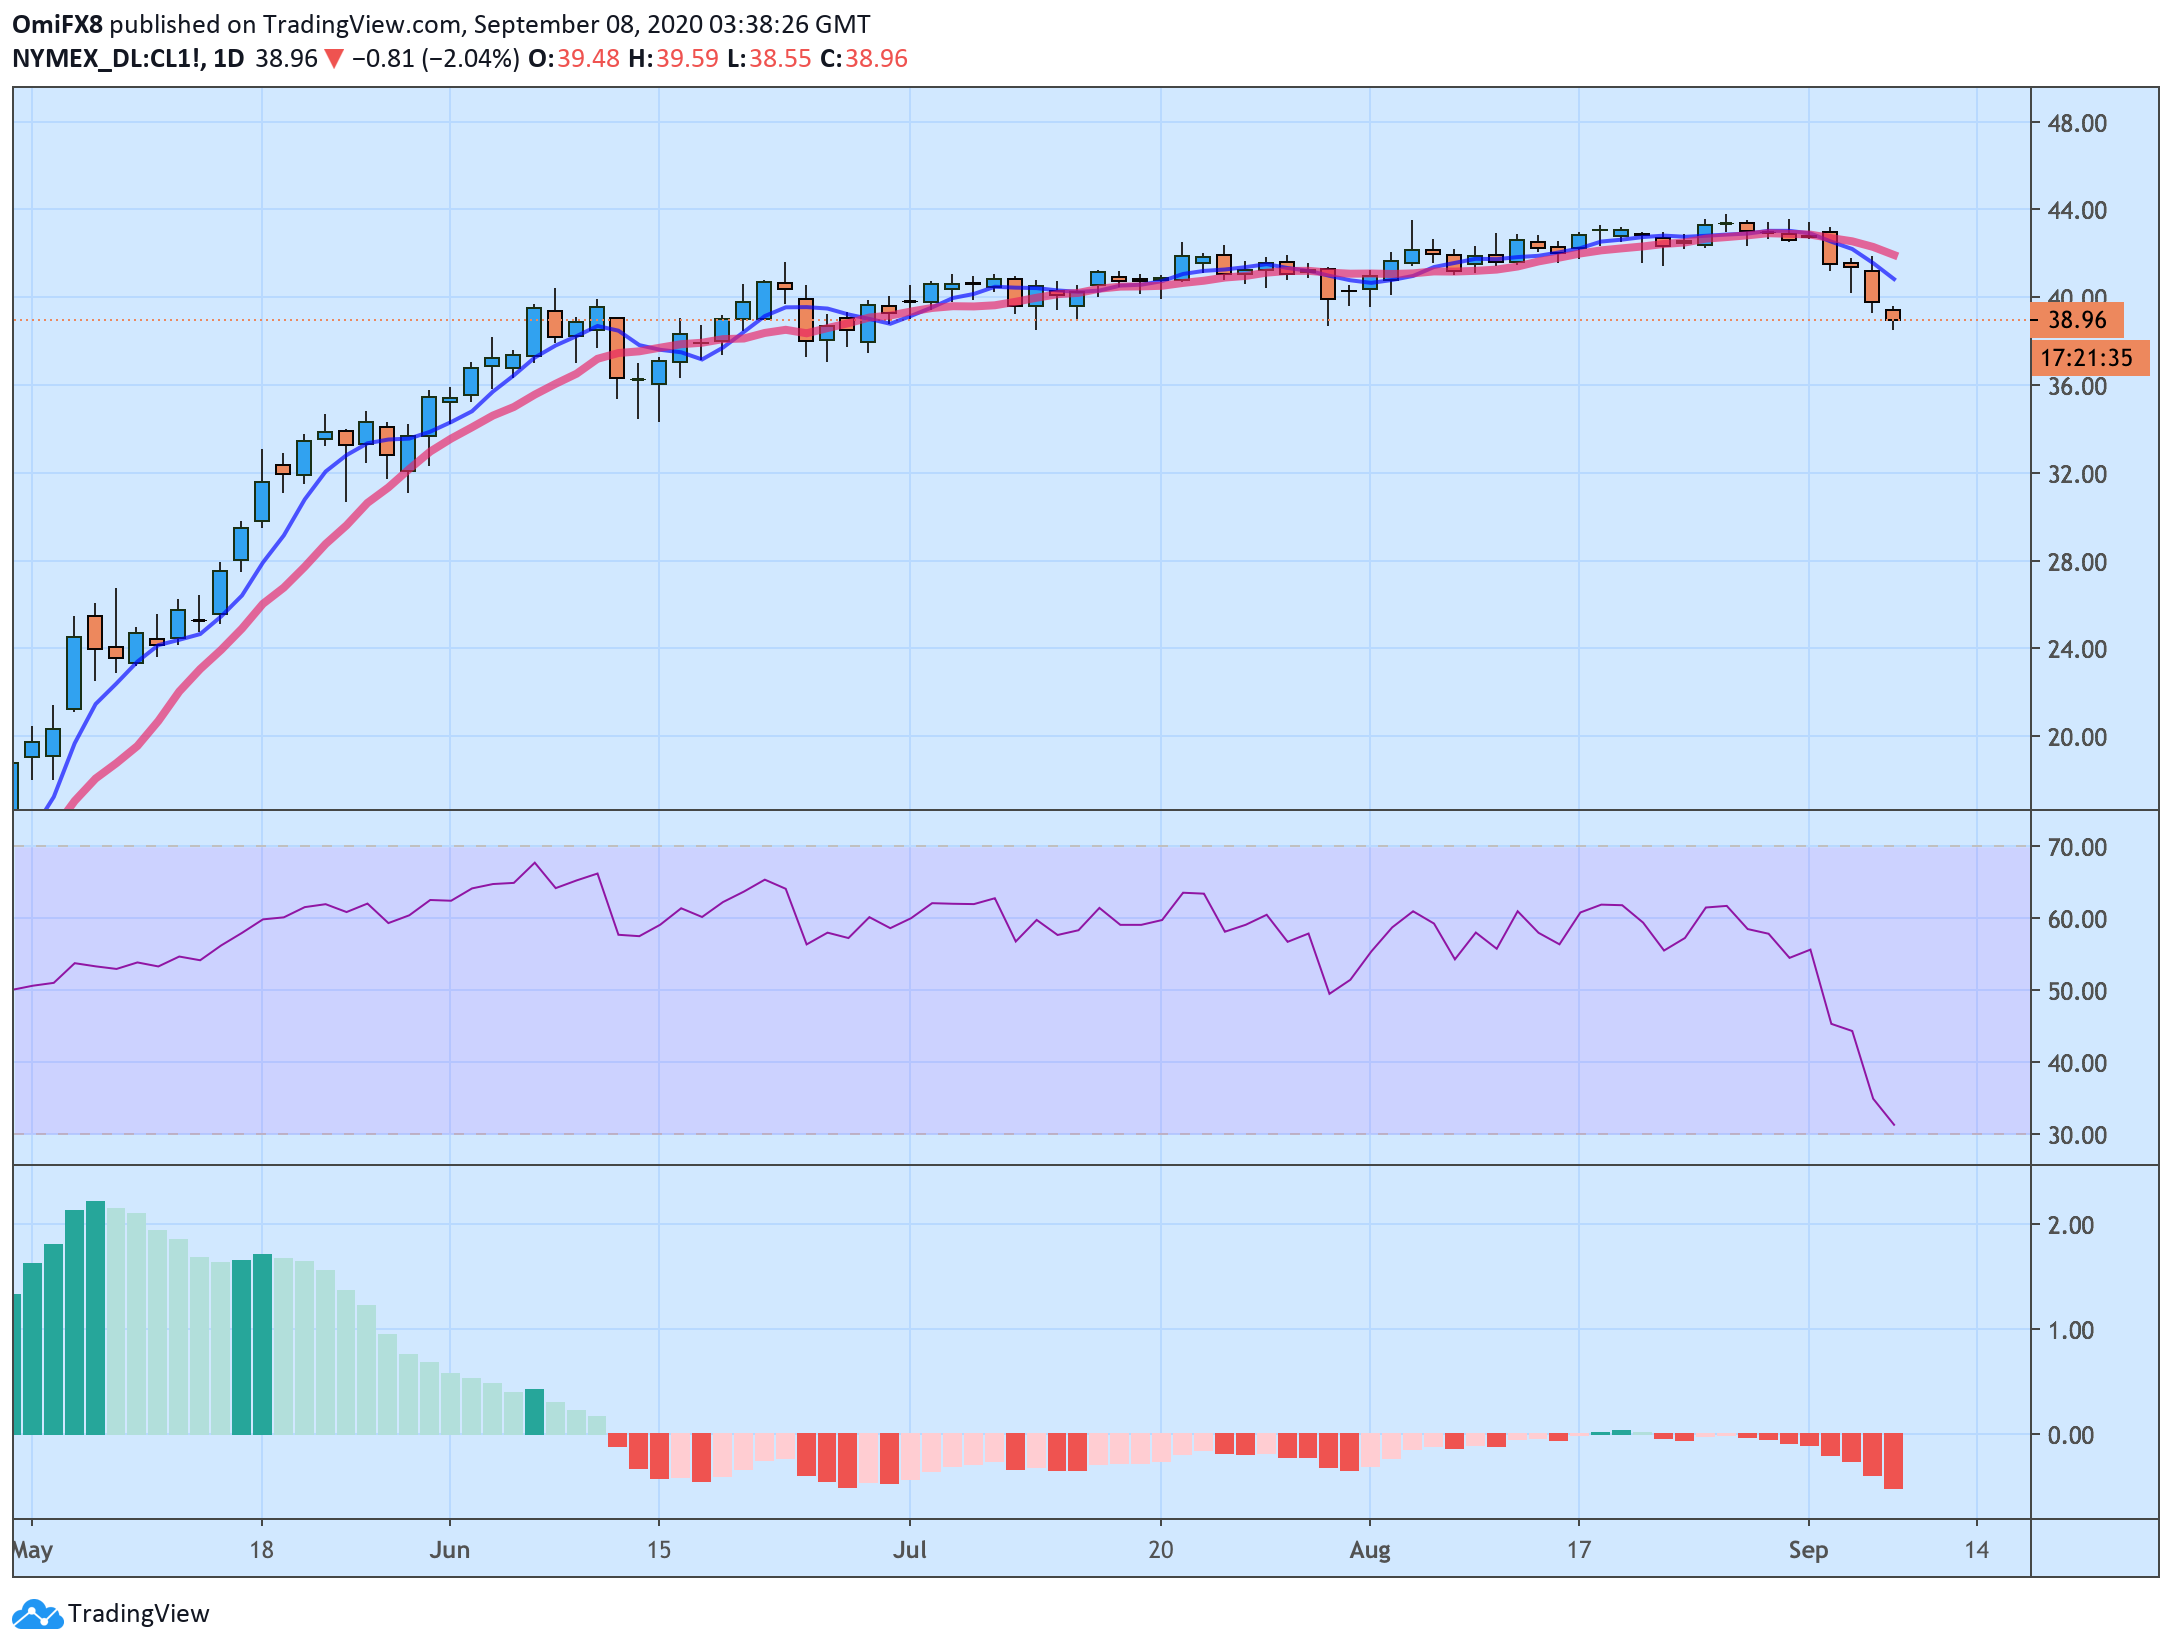
Trend: Bearish

Technical levels


China’s Pres. Xi: COVID-19 data has been transparent, true

While attending a meeting to commend role models in China's fight against the COVID-19 epidemic, President Xi Jinping said that his country has acted
مزید پڑھیں Previous

USD/IDR Price News: Indonesian rupiah drops to 14,795 despite improved Consumer Confidence

The latest survey conducted by Bank Indonesia (BI), the Indonesian central bank, showed that the country’s Consumer Confidence Index worsened to 86.9
مزید پڑھیں Next