Confirming you are not from the U.S. or the Philippines

یہ بیان دے کر، میں واضح طور پر یہ بتاتا اور تصدیق کرتا ہوں کہ:
  • میں امریکی شہری یا رہائشی نہیں ہوں
  • میں فلپائن کا رہائشی نہیں ہوں
  • میں بالواسطہ یا بلاواسطہ امریکی باشندوں کے 10 فیصد سے زیادہ شیئرز/ ووٹنگ کا حق/ امریکی باشندوں کے انٹرسٹ کا مالک نہیں ہوں اور/یا دوسرے ذرائع سے امریکی شہریوں یا رہائشیوں کو کنٹرول نہیں کرتا ہوں۔
  • میں بالواسطہ یا بلاواسطہ امریکی باشندوں کے 10 فیصد سے زیادہ شیئرز/ ووٹنگ کا حق/ انٹرسٹ کا مالک نہیں ہوں اور/ یا کسی دوسرے ذریعے سے امریکی شہری یا رہائشی کے کنٹرول میں نہیں ہوں۔
  • میں FATCA کے سیکشن (a)1504 کے معاملے میں امریکی شہریوں یا رہائشیوں کے ساتھ وابستہ نہیں ہوں
  • میں غلط اعلان کرنے پر اپنی ذمہ داری سے واقف ہوں۔
اس بیان کے مقاصد کے لئے، ریاستہائے متحدہ امریکہ کے تمام منحصر ممالک اور علاقوں کو امریکہ کے مرکزی علاقے کے برابر کردیا گیا ہے۔ میں اپنے اس بیان کی خلاف ورزی سے پیدا ہونے یا اس سے متعلق ہونے والے کسی بھی دعوے کے خلاف، بے ضرر آکٹا مارکیٹس انکارپوریٹڈ، اس کے ڈائریکٹرز اور افسران کا دفاع کرنے کا عہد کرتا ہوں۔
ہم آپ کی رازداری اور آپ کی ذاتی معلومات کے تحفظ کے لیے وقف ہیں۔ ہم محض اپنی پراڈکٹس اور سروسز کے متعلق خصوصی پیشکشوں اور اہم معلومات فراہم کرنے کے لیے ای میلز اکٹھا کرتے ہیں۔ اپنا ای میل ایڈریس دے کر، آپ ہم سے ایسے ای میلز وصول کرنے پر اتفاق کرتے ہیں۔ اگر آپ انسبسکرائب کرنا چاہتے ہیں یا کوئی سوالات یا خدشات ہوں تو، ہماری کسٹمر سپورٹ کو لکھیں۔
Back

GBP/USD Price Analysis: Bulls target breakout to old hourly support

  • GBP/USD bulls are taking charge on the shorter-term time frames but bears lurking. 
  • The price action is choppy as traders await the Fed, but technicals speak for themselves. 

The following is a top-down analysis that illustrates the bearish bias for the near/medium term compared to a  bullish bias longer term.

For the very immediate future, the bulls are taking charge and are on the verge of a breakout to the hourly resistance as shown below. 

Monthly chart
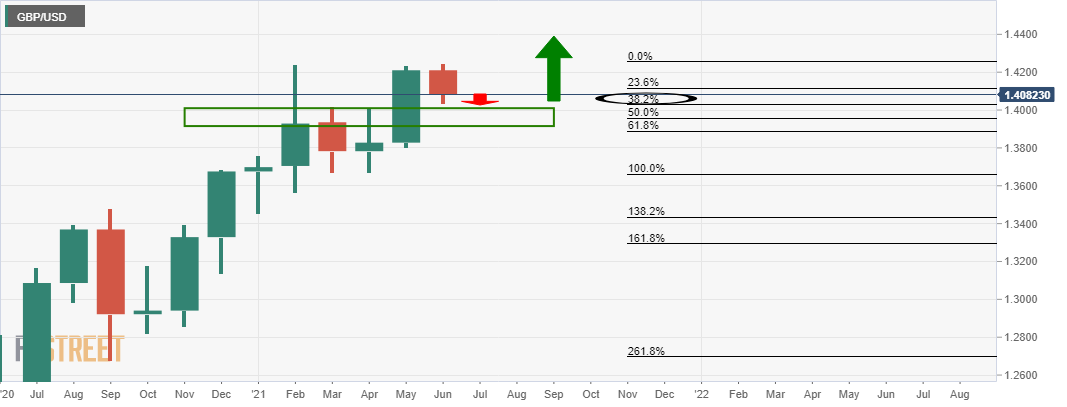
The monthly chart is bearish near term, bullish longer term.

A fuller test of the 38.2% Fibonarri is expected.

Weekly chart
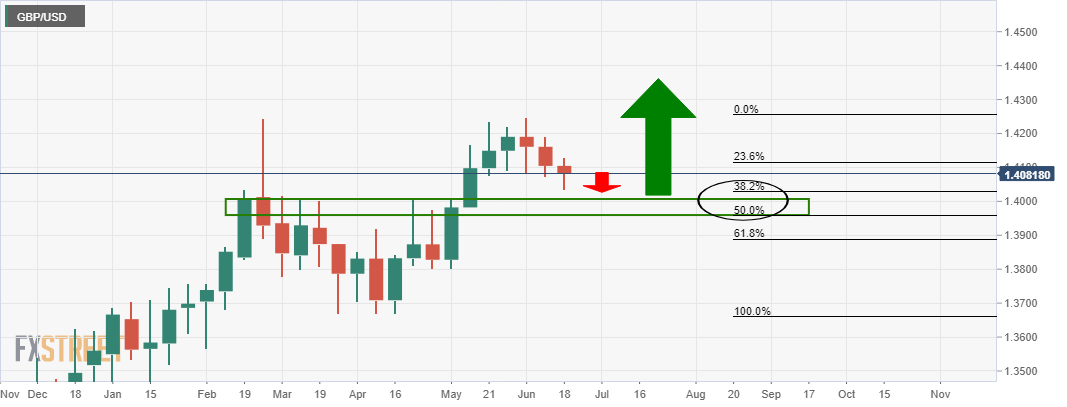
As the weekly chart illustrates, the bears are in control and there is space to go until the weekly old resistance s properly tested. 

Daily chart 
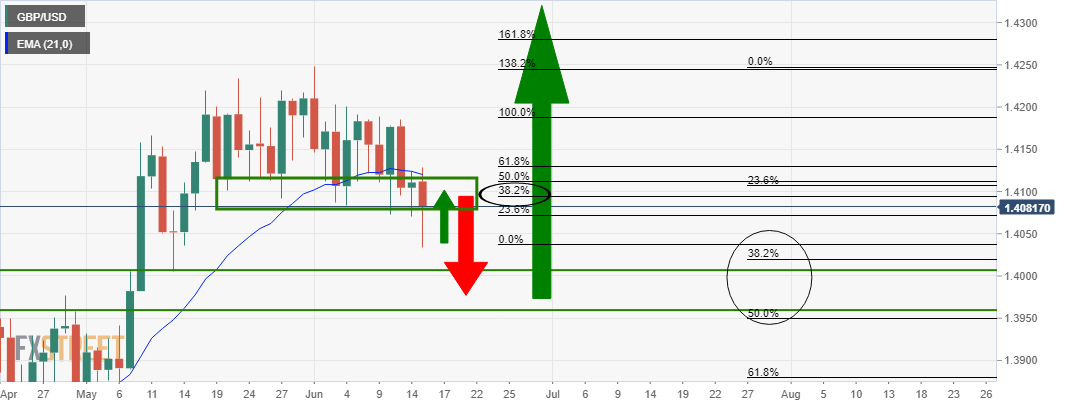
The daily chart illustrates that the bulls are attempting to test old support. 

Hourly chart
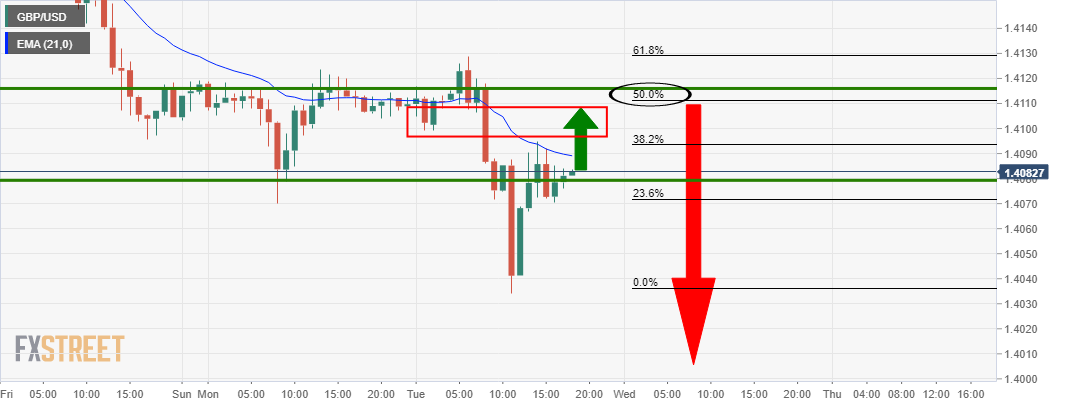
This gives rise to an imminent breakout on the hourly chart to test old hourly support for the hours ahead. 


Gold Price Forecast: XAU/USD extends slide toward $1,850, eyes 200-day SMA at $1,840

After closing the first day of the week in the negative territory, gold remains on the back foot on Tuesday and was last seen trading at $1,855, where
مزید پڑھیں Previous

AUD/USD steadies below 0.7700, on track to post lowest daily close in 12 days

The AUD/USD pair dropped toward 0.7700 during the European trading hours and extended its slide in the second half of the day to a fresh 11-day low of
مزید پڑھیں Next