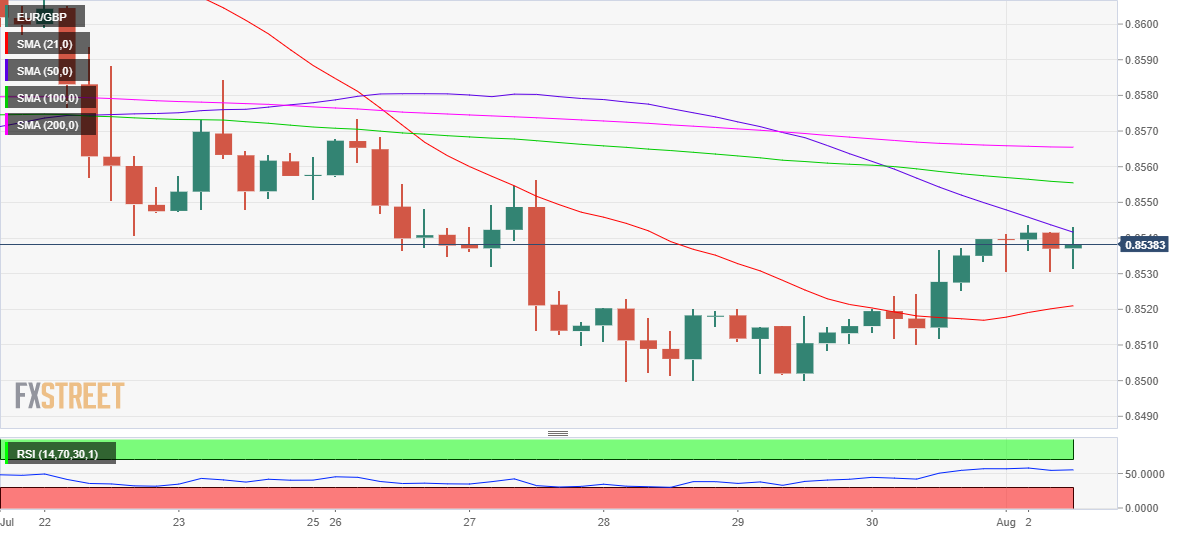
EUR/GBP Price Analysis: 50-SMA capping the recovery below 0.8550
- EUR/GBP’s four-day recovery triggers a falling wedge breakout on the 1D chart.
- A rally towards the 200-DMA at 0.8767 cannot be ruled out in the medium term.
- RSI has turned lower but remains comfortably above the midline.
EUR/GBP has stalled its recovery momentum on Monday, consolidating Friday’s sharp rebound above 0.8500.
The cross run into the critical bearish 50-Simple Moving Average (SMA), now at 0.8541, which is capping the upside attempts over the last hours,
A four-hourly candlestick closing above that resistance is needed to take on the next bullish target at 0.8555, where the 100-SMA aligns.
Further up, the horizontal 200-SMA at 0.8565 could be challenged if the bulls remain persistent.
The Relative Strength Index (RSI) is inching higher above 50.00, suggesting that there is scope for additional upside.
EUR/GBP daily chart

However, a failure to recapture 50-SMA on a sustained basis could recall the sellers, which could initiate a fresh sell-off towards the ascending 21-SMA at 0.8521.
Further south, the 0.8500 round number could get tested, opening floors towards the April lows of 0.8472.
EUR/GBP additional levels to watch
