GBP/USD Price Analysis: Seesaws near 1.3250, bearish pennant in focus
- GBP/USD consolidates recent losses, picks up bids around yearly low.
- Bearish chart pattern, absence of oversold RSI keep sellers hopeful.
- Key SMAs, monthly resistance line adds to the upside filters.
GBP/USD grinds lower despite picking up bids to 1.3250 during Wednesday’s Asian session.
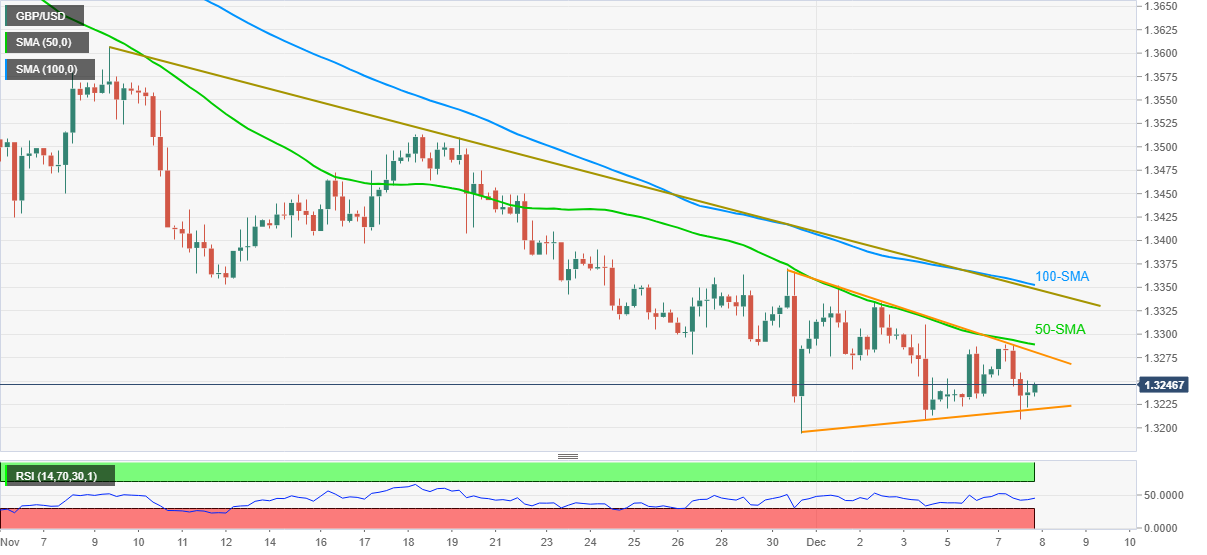
The cable pair remains pressured for the last one week around the 20221 bottom. In doing so, it forms a bearish chart pattern called pennant and keeps the sellers hopeful. Also favoring the bears is an absence of the oversold RSI.
However, a clear downside break of 1.3220 becomes necessary for the GBP/USD sellers to aim for the theoretical target surrounding 1.2900.
During the fall, the yearly low near 1.3190 and the 1.3000 psychological magnet will act as intermediate halts.
Meanwhile, 50-SMA adds strength to the pennant’s resistance line, around 1.3290, to challenge the recovery moves.
Even if the quote rises past 1.3290, a convergence of the 100-SMA and one-month-old descending trend line near 1.3350 will be a tough nut to crack for the GBP/USD buyers.
To sum up, GBP/USD bears keep reins and await a clear break of 1.3220 for further dominance.
GBP/USD: Four-hour chart
Trend: Bearish