GBP/USD Price Analysis: Remains vulnerable to further downside past 1.2600
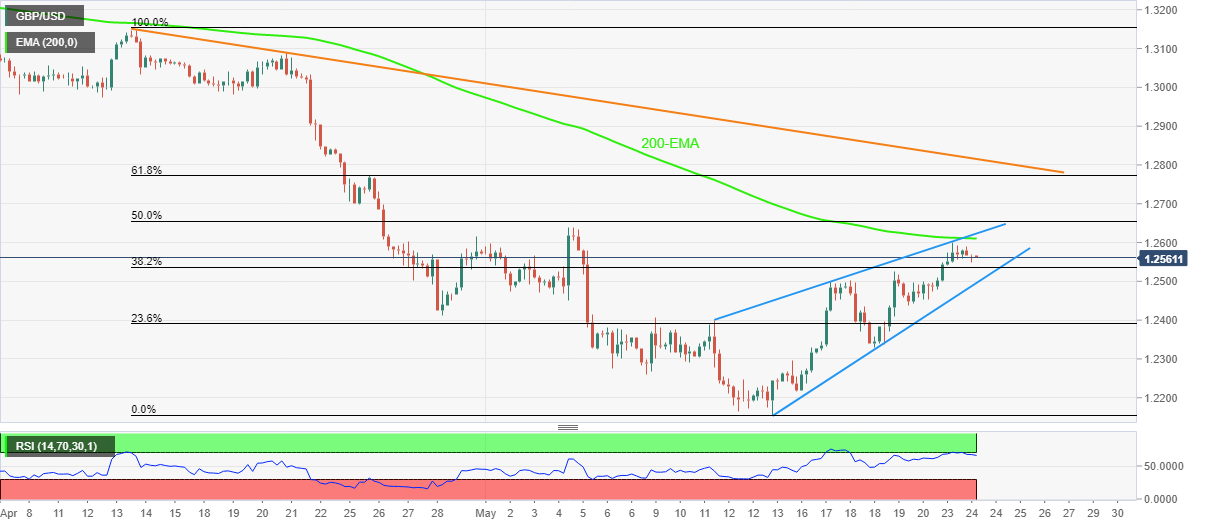
- GBP/USD retreats from 13-day top inside weekly rising wedge.
- 200-EMA, overbought RSI add strength to the pullback moves.
- Descending trend line from mid-April acts as extra filter to the north.
GBP/USD consolidates a three-day uptrend around a fortnight top, easing to 1.2565 ahead of Tuesday’s London open.
In doing so, the cable pair carries the previous day’s failure to cross the 200-EMA amid the overbought RSI (14) line.
However, the bears need a clear downside break of the 1.2500 threshold, comprising the support line of a weekly rising wedge bearish chart pattern, to retake control.
Following that, 1.2270 and the monthly low of 1.2155 can entertain traders ahead of the theoretical target surrounding 1.2050.
Meanwhile, recovery moves not only need to cross the 200-EMA level of 1.2610 but also cross the upper line of the stated wedge, near 1.2625, to favor the GBP/USD buyers.
In a case where the cable prices remain firmer past 1.2625, the 61.8% Fibonacci retracement of April-May fall and a five-week-old descending trend line, respectively around 1.2775 and 1.2815, will lure the bulls.
Overall, GBP/USD is likely to stay on the bear’s radar but validation from 1.2500 becomes necessary.
GBP/USD: Four-hour chart

Trend: Further weakness expected
