USD/CHF Price Analysis: Drops to fresh four-week lows and sellers eye the 200-DMA
- USD/CHF prepares to finish the week with solid losses of 1.01%.
- From a daily chart perspective, the USD/CHF shifted to a neutral-downward bias.
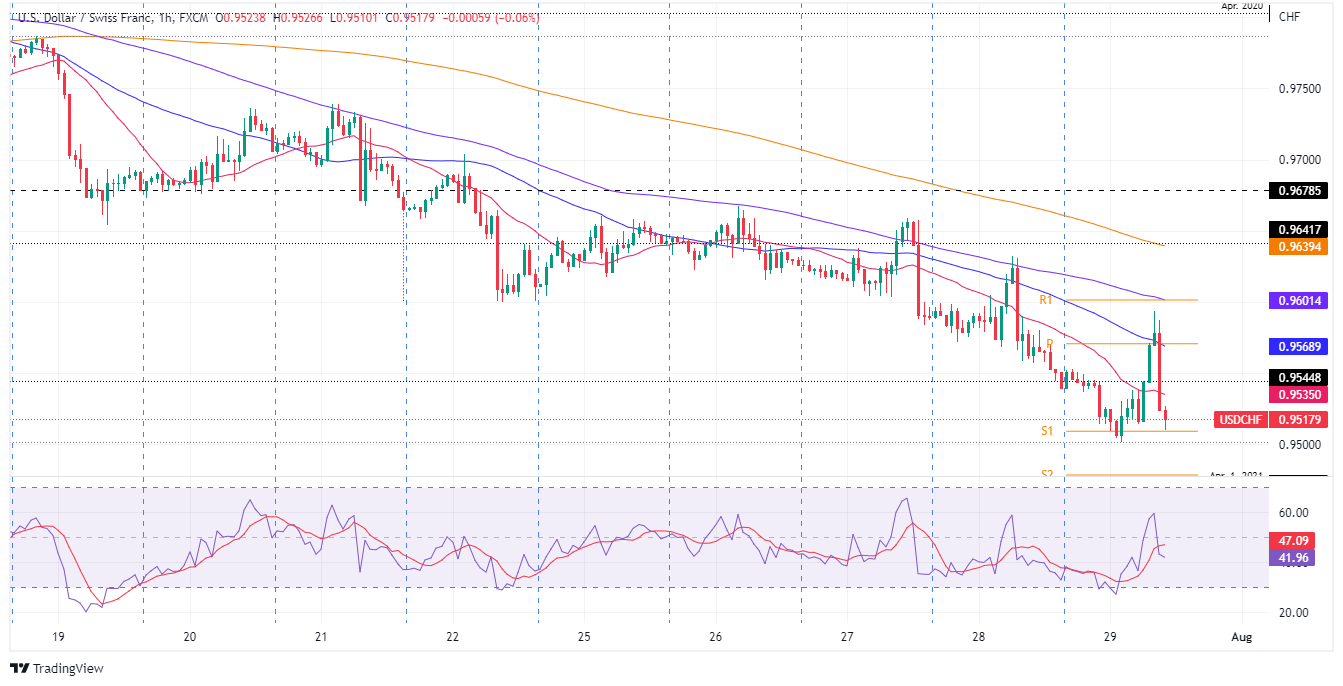
- The USD/CHF hourly chart reinforces the daily bias, as sellers eye a break below 0.9495 on their way to the 200-DMA.
The USD/CHF slides for the fourth straight day out of five in the week, approaching the June 29 cycle low at 0.9495, which, if decisively broke, would pave the way for a USD/CHF fall towards the 200-day EMA at 0.9409. At the time of writing, the USD/CHF is trading at around 0.9517.
USD/CHF Price Analysis: Technical outlook
The USD/CHF daily chart illustrates that the pair has shifted to neutral-to-downward biased. Readings at oscillators, particularly the Relative Strength Index (RSI), is in bearish territory and nowhere near reaching oversold conditions, opening the door for further USD/CHF downward action. Hence, as mentioned above, once the major clear 0.9495, that will open the door for further losses.
USD/CHF 1-hour chart
In the near term, the USD/CHF hourly chart illustrates that the pair has been seesawing between the daily high and low at 0.9593 and 0.9501, respectively. But once the dust has settled, the exchange rate is at current levels, just above the S1 daily pivot. USD/CHF traders should be aware that in the last couple of hours, the RSI slid below its 7-period SMA, suggesting that downside pressure lies ahead.
Therefore, the USD/CHF bias is downwards, and its first support would be 0.9495. Once cleared, the next support would be the confluence of April 2020 low and the S2 pivot point around 0.9472-80, followed by the S3 daily pivot point at 0.9417.

USD/CHF Key Technical Levels
